
No, the Economy is Not Great Right Now
Six Often-Ignored Indicators Show Weakness in Our Economy

Many politicians, journalists, and economists seem puzzled. They claim the US economy is great and are puzzled that the public doesn’t agree.
Some will cite that unemployment is low and that inflation is no longer at its recent peak. Others are calling it a “vibecession”. Others just question the public’s perception in articles like these. But as we’ll discuss, the “experts” are overlooking a lot.
First, there are some reasons to be optimistic about the economy. While we had two quarters of negative Gross Domestic Product (GDP) growth in 2022, GDP has been growing since. Unemployment rates are indeed low, and inflation is dropping. Things seem to be trending in the right direction, albeit slowly. Those are all good things. Beyond that, historically, things are great. In the USA, we are richer than we were 10, 20, 50+ years ago. Fewer people in the world are living in dire poverty, as one of my all-time favorite charts shows.
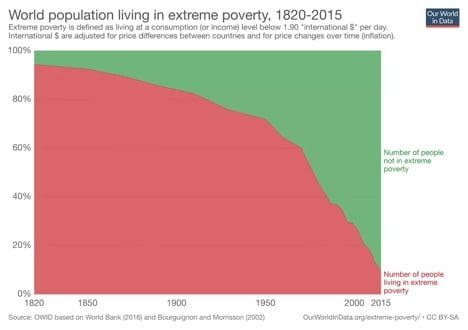
To the extent that we have semi-free markets and capitalism without too much government interference, I expect that in the coming decades the average person 10, 20, and 50+ years from now will be much better off than we are today.
That said, there are several economic indicators that economists and others are overlooking that show real weakness with the economy and validate the public’s concerns.
The experts are wrong, what are they ignoring?
We cover six different data points that show there is still economic pain happening. The public isn’t misperceiving a struggling economy, these are important factors show a weak economy.
1. High interest rates are not factored into the inflation rate.
The inflation rate has dropped from the 2022 highs and is back to the 3-4% range. The inflation rate, however, does not include the cost of borrowing money. Given interest rates are up dramatically, this is causing economic pain for many households, as the cost of getting a loan is much higher than in 2020.
Let’s look at an example to get a sense of the problem. A $30,000 car loan at an 8% interest rate would result in $2,400 in interest per year, or $200 per month. At a 4% rate, the interest expense is $1,200 per year. The higher interest rate would cost someone an extra $100/month. That is a lot of money, and this is not factored into the official inflation calculations.
(For more on interest rates, check out a recent episode of the Economics Happy Hour podcast I co-host with Jadrian Wooten.)
2. Real median income has fallen.
The real median household income is down from the pre-pandemic highs. ”Real” median household income means inflation-adjusted, and that median is the average, with 50% of households earning more and 50% earning less.
The St. Louis Federal Reserve shows that inflation-adjusted median incomes are down about $4,000, or 5%, from the pre-pandemic peak. That data only goes through 2022, however. Motio Research has a January 2024 estimate of $77,400, a more recent and higher income estimate, but still thousands below their estimated peak in 2020.
Either way, the average American family has seen a drop in their incomes in recent years.


3. Real household net worth hasn’t gone up in three years.
A household’s net worth is the amount of assets they own - home, retirement accounts, cars, etc. - minus the debts they owe. A recent Wall Street Journal article examined household net worth (and the stock market) in recent years.
Net worth when not accounting for inflation was up for both Biden and Trump by this point in their presidencies. However, as you can see, real (inflation adjusted) net worth is flat under the Biden Administration. By this time in the Trump presidency, total American household’s net worth, adjusted for inflation, had increased by about 15% and ended almost 30% higher.

4. The stock market under Biden is lagging what we saw under Trump or Obama.
The same Wall Street Journal analysis also shows the stock market’s performance under Biden and under previous two presidents. At this exact moment in time, the stock market is doing about as well under Biden as Trump, up about 25%, but that’s only because this moment in time is when the markets were still in a slump from Covid-19 during the Trump presidency. The stock market is not performing as well under Biden as it did under Trump, as we see in this chart.

It isn’t just that things were better under Trump and that was an exceptional time for stocks. The stock market is doing worse under Biden than under every recent president other than George W. Bush, who took office at the height of the dot-com bubble.

The stock market is the way many Americans fund their retirements and their other dreams. Naturally, this lagging performance will cause people to question the strength of the economy.
5. Inflation is higher than what it was in the decade before the pandemic
We discussed how the inflation rate does not the cost of borrowing money earlier. Even ignoring the higher interest rates, inflation is currently at 3.36%. Before the recent spike in inflation, we had rarely exceeded 2% in the past decade and had never exceeded 3%.
Inflation is the increase in prices and is usually reported as the annual increase. One factor to consider with current inflation rates is that prices are increasing on products that already saw big price increases because of the recent inflation spike. A 3% increase on a product that is $1,000 is $30. But because of the recent high inflation rates, we’re seeing a 3% increase on a product that might now cost $1,100 or $1,150, meaning the increase is $33-$34.50.
These two charts show that while inflation is down from its peak, it is still higher than pre-2021 levels.


6. The US National Debt has increased which means more tax revenue is going to pay back the debt.

The national debt keeps growing, and that’s not good. If you’re old enough, you might remember that Ronald Reagan faced criticism over increasing deficits/debt during his presidency. The total debt when Reagan left office was about $3 trillion. It was about $5 trillion when George W. Bush took office and $10 trillion (doubling) when he left office eight years later. Under Obama, the debt doubled again to $20 trillion by the time he left office. And now it has almost doubled again in the seven plus years since Obama has left the White House.
We’re now paying over $1 trillion in interest payments on debt annually, an average of over $3,000 per American. These higher interest payments mean we either have higher taxes or less services than if we didn’t have this debt, and the debt is getting so large that it threatens to slow down growth.
Sadly, neither political party seems to want to address the national debt, which is one of the more significant concerns I have about the economy being able to grow in the future.
Conclusion: How is the economy performing right now?
Inflation and unemployment rates are two key economic indicators. And the fact that unemployment rates are low, and inflation is down from the recent peak, is good news. But those who are mainly focused on just those two economic indicators are missing a lot of important details on the American economy.
Americans are earning less, suffering from higher inflation than expected, suffering from higher interest rates that isn’t captured in the official inflation estimates, and have seen stagnant stock market performance relative to previous presidential administrations.
On top of this, the debt is now so large that we are seeing higher taxes and/or fewer services from our tax payments.
I am generally an optimist and think things will improve over time. That includes improvement for some of the factors described in this article. But at this moment in time, no, the economy is not great.
I love that this article started as an actual argument in a bar. Which I was present to witness.